Printing in Power BI is effortless with the know-how. Follow these simple steps for all your printing needs. Select what you want to Print, i.e., dashboard, select to Export, choose Print or Print this page – adjust the print settings in your browser window and click Print. Job Done!
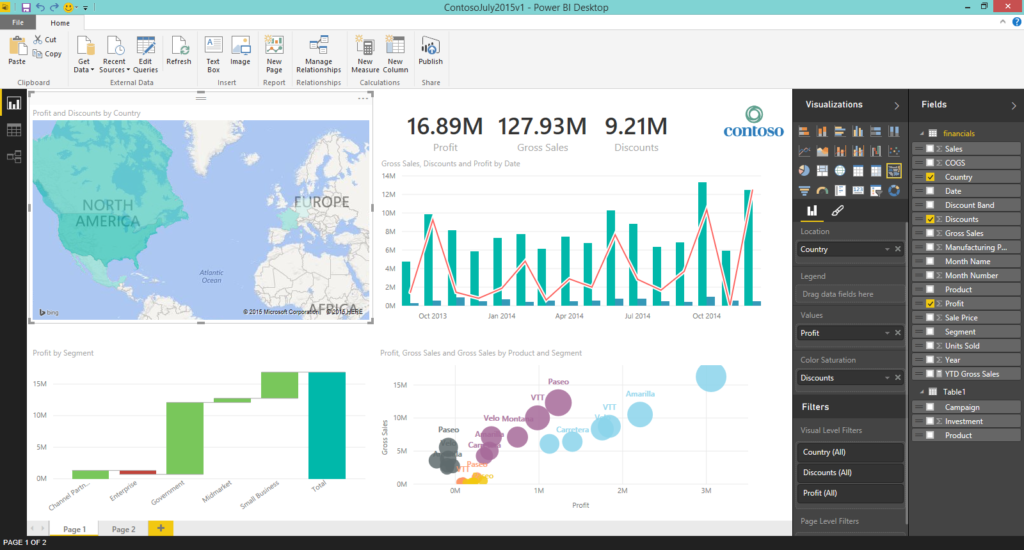
Last week I was sitting at my desk feeling proud of a new operational dashboard I had just created for a project I support. That feeling was short-lived when asked by a Senior Operations Manager to print copies ready for the weekly operations meeting in 10 minutes! I had no idea how to do it? At first, I was in a bit of a panic because I wasn’t able to find anything quickly when I searched online. Information was patchy at best, making it difficult to find a quick answer to my problem. Lucky for me, I have a colleague who has been using Power BI since it launched back in July 2015 he was able to guide me through the process. I managed to have the dashboards printed and place them on the table just in time for the meeting, Phew! After this experience, I thought, “wouldn’t it be nice if there was an article available providing a quick overview of the printing options and how to do it.” Well, here it is, hope it helps.
 Source: https://powerbicdn.azureedge.net/mediahandler/blog/legacymedia/6574.01.png_2D00_550x0.png
Why might you need to Print your Dashboard, Tile, Report, or Visual?
After spending countless hours connecting your data sources, refining your slicers, and customizing the look and feel of your dashboard. You might feel a little disappointed when someone asks you to print it. Don’t, when it comes to data intelligence, and the use of technology in business, things have changed dramatically in the last ten years. Gone are the days of compiling data from multiple excel files or spending hours writing codes or formulas to generate tabular reports. We are in the age of BIG data and Cloud-based technology, which provides access and storage to vast amounts of data (with minimal fuss). Combine that with Incredible Cloud-based Features, Intuitive UX, Advanced Row Level Security, and we end up with faster insights to our businesses than ever before. OK, enough rambling, I’m sure you already know that, back to the original question.
Why would you need to print anything you create in Power BI?
Having spent the last 15 years working in a corporate environment, I have experienced lots of changes in technology and observed human behavior during the transition. Until the majority understands and accepts the likes of Power BI as the new ‘norm.’ Those who have been around decades (also known in the industry as; BigWigs, Big Cheese, Kingpin, or Dinosaur, among other things). Will still want something they can hold onto (like the last leaf on an Autumn tree refusing to accept the inevitable). For options on ‘What‘ and ‘How‘ to print read below;
Three simple steps to printing dashboards from Power BI Services
- Select the Dashboard you would like to Print and open it.
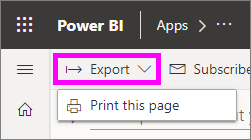
- Look in the top left corner – click Export then select Print this page.
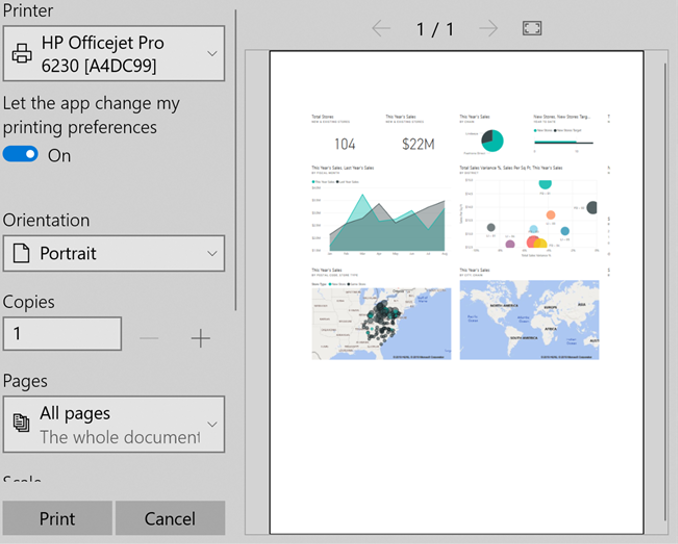
- Your browser’s Print window will open. Adjust your settings and choose a Destination printer, now click Print.
Printing your dashboard will help get your work noticed by a wider audience than just those attending a meeting. Providing the dashboard data and visualizations tell the story. They will be used multiple times during different types of interactions, depending on the subject matter. For example, a Financial dashboard used during a board meeting will likely be used to review results with management teams and potentially all employees, for example, an Annual report.
How to print a dashboard tile
- Use the Expand icon in the top menu to open the dashboard in Full-screen mode.
- Hover over the More options icon […] and select Open in focus mode.
- To reveal the Options menu hover over the tile to see the following options

- Click the Print icon

You might be thinking, what’s the benefit of printing a dashboard tile? Using the example above regarding a Financial dashboard; It may be more relevant for your audience to focus on a specific item — i.e., Gross margin, Revenue vs. Budget, Sales revenues, Sales target, etc. I like to do this to keep meetings more efficient and the discussions on point. Helping to drive more meaningful conversations and resulting in better outcomes from meetings.
How to print a Report
IMPORTANT: Please note reports can only be printed one page at a time.
- Choose a report and select Export.
- Select Print – this will print the current page.
- Your browser Print window will open. Adjust your settings and choose a Destination printer, now click Print.
- Repeat the process above if the report contains multiple pages.
A great way to ensure people who don’t have access (yet) to the reports in Power BI still receive a copy. It’s also useful for people who take more time to digest information or don’t have access to the internet, for example, an Executive or Director on a business trip. Long haul flights are a perfect opportunity to catch up and review essential topics. Without the usual distractions of an office environment (that is unless the person next to you snores like a train) — [best earplugs for flying].
How to Print a Visual
- Use the Expand icon in the top menu to open the dashboard in Full-screen mode.
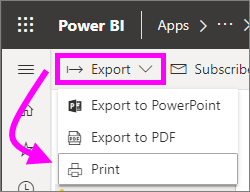
- Look in the top left corner – click Export then select Print to print your visual.
Here are some of the issues I ran into (and you might too) when attempting to print your first visual. You can only print 1 page at a time. To Print to PDF first, you need to configure the PDF driver in your browser; otherwise, the option is not available. Depending on the browser you are using Print screens may vary. Power BI does not control things like orientation, margins, visual details, size, and scaling. If you run into any issues like these, refer to your specific browser documentation.
How to save Power BI as PDF
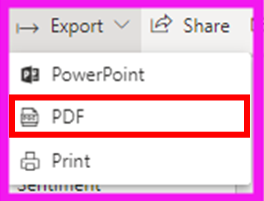
- From the menu bar, select Export > PDF.
- A pop-up window will appear. Select Current values or Default values [for more details on values click here].
- Select Export to proceed.
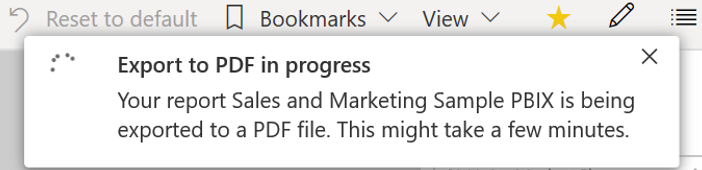
- A progress bar will appear in the top right corner stating Exporting might take a few minutes.
- You will be prompted to choose what you want to do with the file, Open, Save, or Cancel.
- After saving the PDF file, you can find it in your browsers downloaded files location.
Having issues with the format of your print outs? Check below for more details.
Limitations and Considerations when Saving to PDF or Printing
Here are 11 considerations and restrictions to keep in mind when you work with the Export to PDF feature and Printing.
- If you are attempting to Export to PDF and cannot see the option, chances are the feature had been disabled by your tenant administrator. Contact them for further details.
- How much time does it take to print a PDF report? Numerous factors can influence the printing time, i.e., report structures, current load on the Power BI service.
- To avoid cropping of charts due to the chart’s bounding area, we recommend removing backgrounds before Exporting to PDF.
- Why are am I seeing distorted images after Exporting to PDF? Most likely, this is caused by using Normal or Fill in the Background page options. To resolve the problem, select the Fit option before Exporting to PDF.
- Are you using a custom visual? If the custom visual you are using has yet to be certified, you will receive an error message. To learn more about getting a custom visual certified, refer to Microsoft’s Get a Custom Visual Certified page.
- When printing a PDF containing R visuals you see blanks and will receive an error message, R visuals aren’t currently supported.
- Choosing Current values before exporting your report will result in URL filters not being respected.
- Does your report contain more than 30 pages? If ‘Yes,’ you will not be able to export it to PDF, the current limit for exporting is max. 30 pages.
- Your Power BI service language preference determines language settings for PDF exports. To change your language preference, select the cog icon
 > Settings > General > Language.
 - Shared reports owned by someone outside your organization or Power BI tenant domain cannot be published to PDF. If you need a PDF copy, please contact the owner of the report.
- Shared dashboards associated reports follow the same logic as shared reports; for example, if you are peter@bigsoso.com, you can share with julie@adabrewery.com. Julie cannot export the reports to PDF because she is outside of your organization and Power BI tenant.
Current Values and Default Values explained
A pop-up appears where you have the option to select Current values or Default values. Current values export the report in the current state, which includes the effective changes you made to slicer and filter values. Most users select this option. Alternatively, selecting Default values exports the report in its original state, as the designer shared it, and doesn’t reflect any changes you made to that original state.
Additionally, there’s a checkbox to select whether or not to export the hidden tabs of a report. Select this checkbox if you want to export only report tabs that are visible to you in your browser. If you prefer to get all the hidden tabs as part of your export, you can leave this checkbox cleared. If the checkbox is grayed out, there are no hidden tabs in the report. After making your selections, select Export to continue.
How were your experiences with printing from Power BI? Was it easy? We’d love to hear your feedback.